Collecting tweets and do some sentiment analysis and visualize with PowerBI
With Microsoft Flow you can do some good things for analysis how people talk about things in social media f.e. twitter.
For this I will collect twitter tweets filter by hashtag, detect the tweet language, do some sentiment analysis on the tweet text and store it in Data verse (formally know as Common Data Service) in a custom table (formally known as entity). To visualize the analysis I will connect PowerBi to Data Verse (formally know as Common Data Service) and build some reporting tiles.
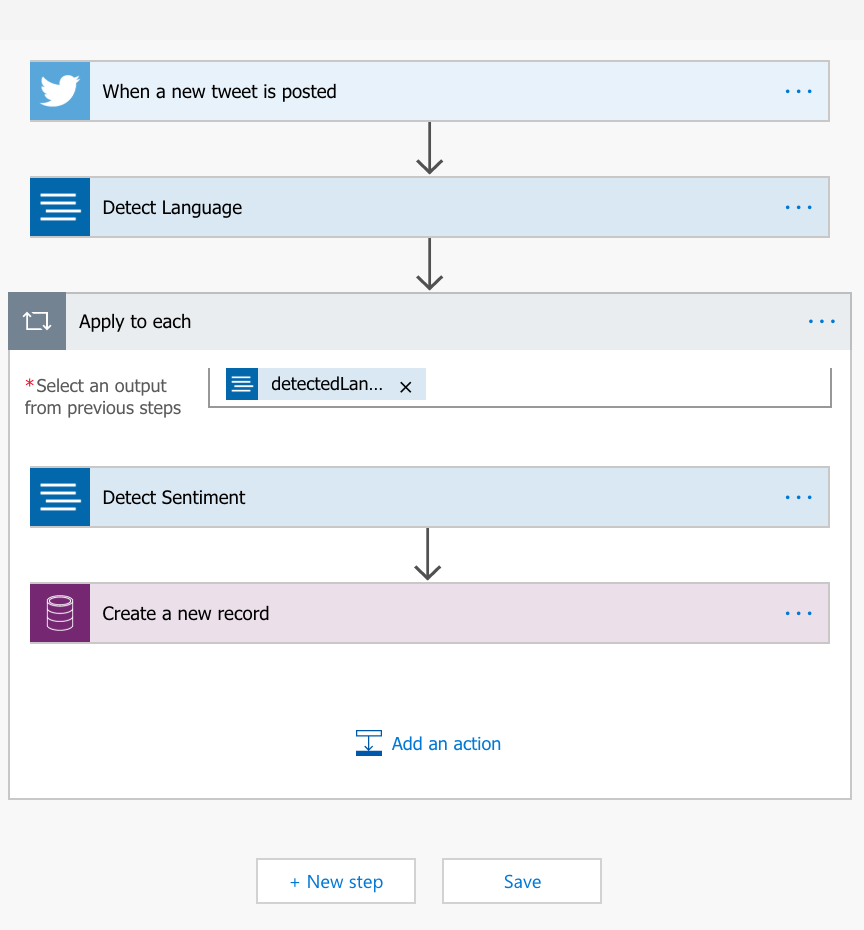
the first step in my flow is the trigger called “When a tweet is posted”.
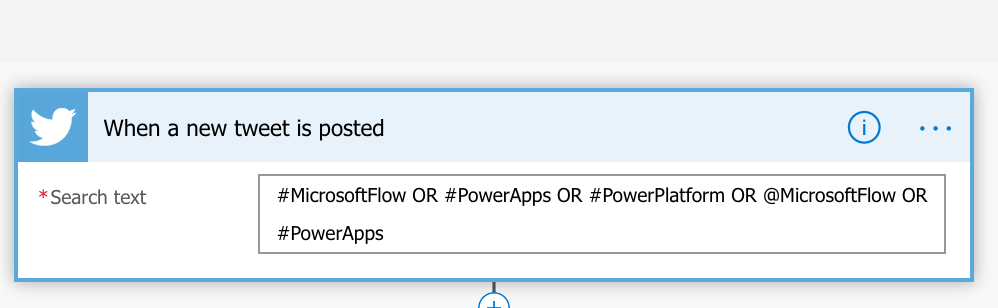
In my example i will collect tweets that mentioned the Microsoft PowerPlatform and the tools in there.
The next step will detect the language of the tweet text. For this I will use the action called “Detect Language” which uses the Microsoft Text Analysis connector. This you have first to create in the Azure Portal to get the keys to set up the connection, there is also a free version available. This is not described here in this post.
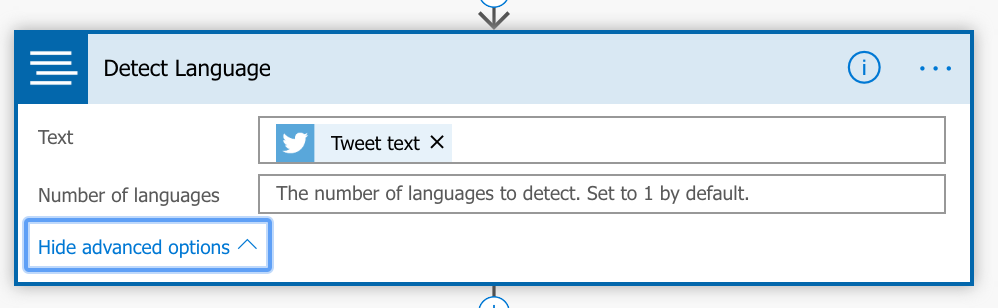
In the field “Text” I will select the “Tweet Text” from the trigger step.
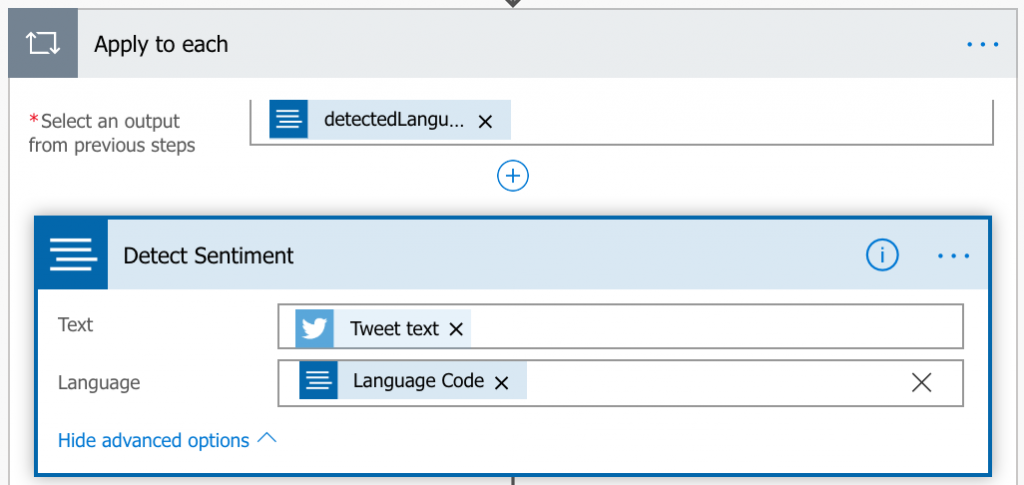
Now I have all to analyze the sentiment of the Tweet Text. To do this I will select as the next step an action that is called “Detect Sentiment”. After inserting the “Tweet Text” as the input there will be a “Apply for each” step. In the field for the language in which the analysis will be done we select the “Language code” from the “detect language” step.
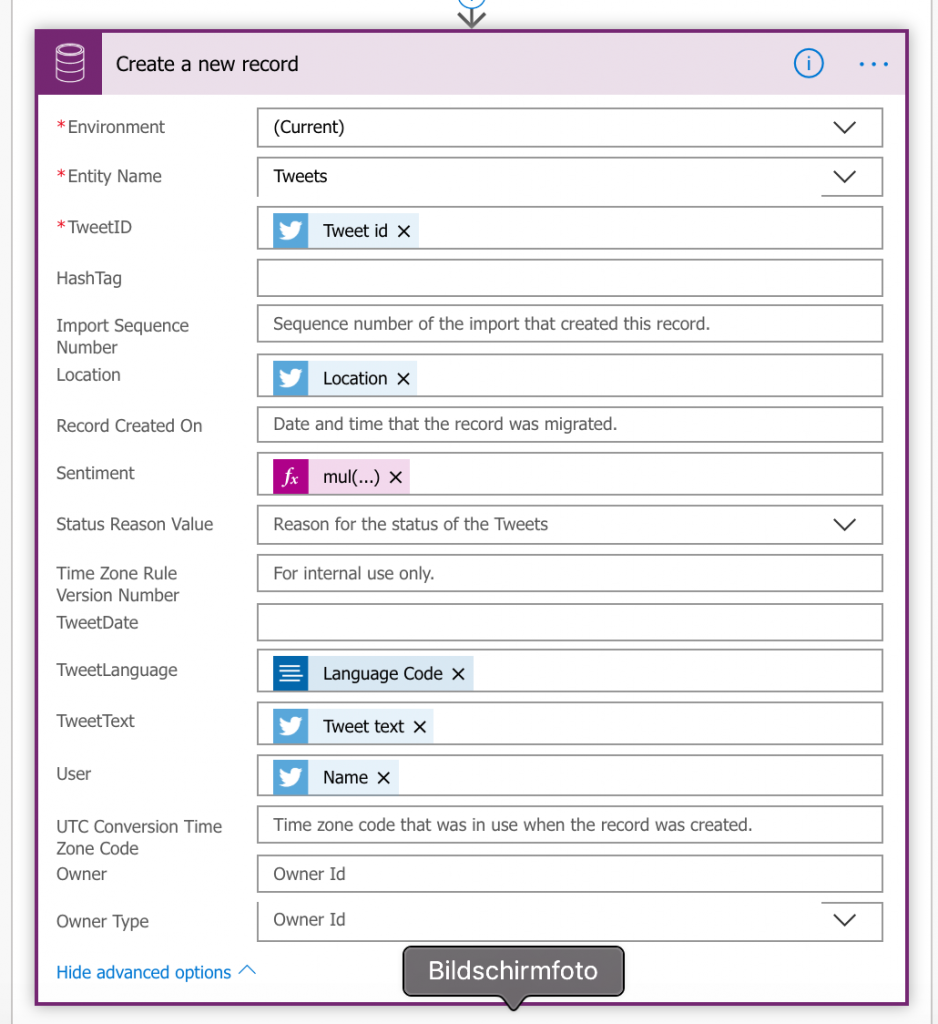
The last step in my is to store the Data in Data Verse (formally know as Common Data Service). First you have to create a custom table (formally known as entity) in Data Verse. This process step is not described here in the post.
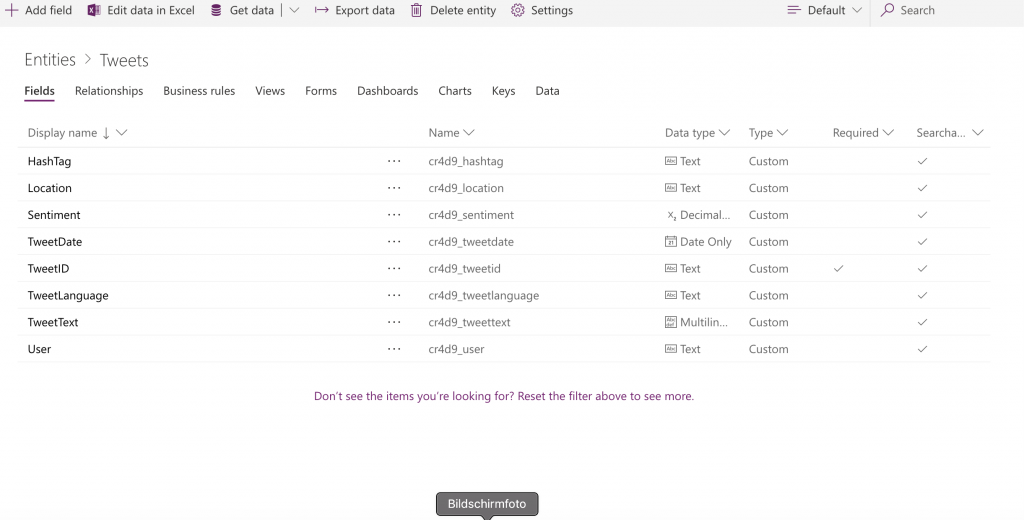
To store the data in Data Verse I will use an action called “Create a Record”. In this action we have to select the environment and the table and we have to select the input for the different columns (formally known as fields) in the table. For this you can use the outputs of the steps before or you can do some expression to f.e. store the actual date/time value.
Here is an overview of the complete flow.
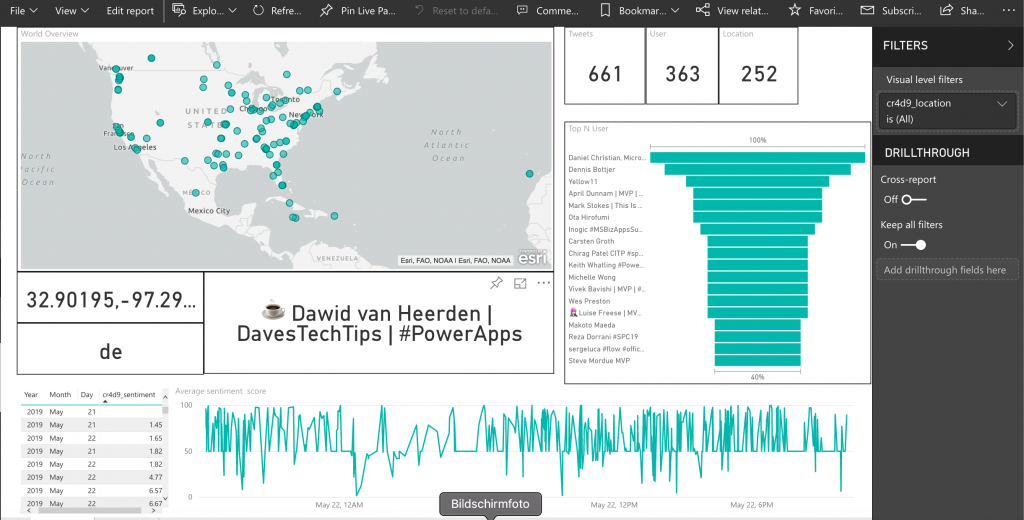
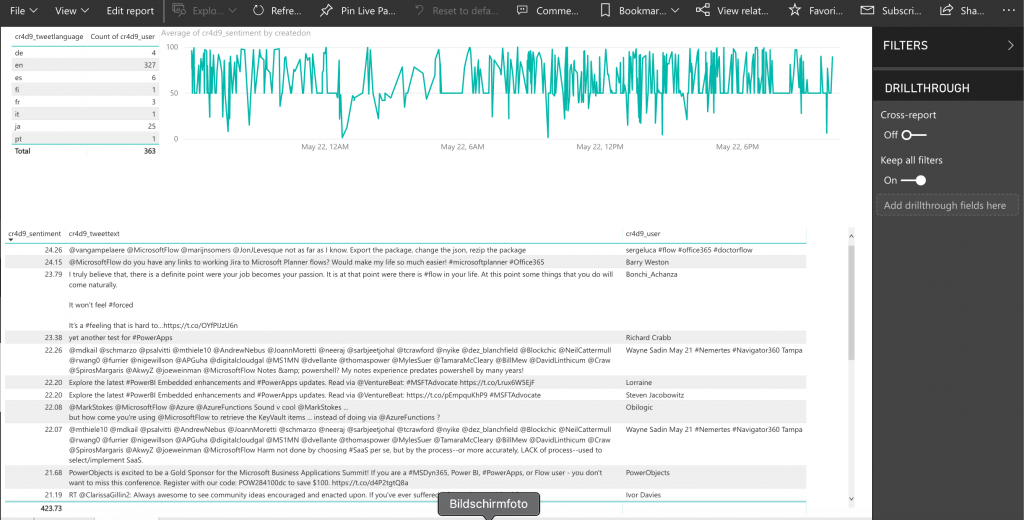
To get some reports or kpi´s for the data I can connect PowerBI to Data Verse and create some reports. Here you can create f.e. a map with the location of the tweets or you show some Top-N table.
Here you find 2 example report pages.
How cool is that? 😉